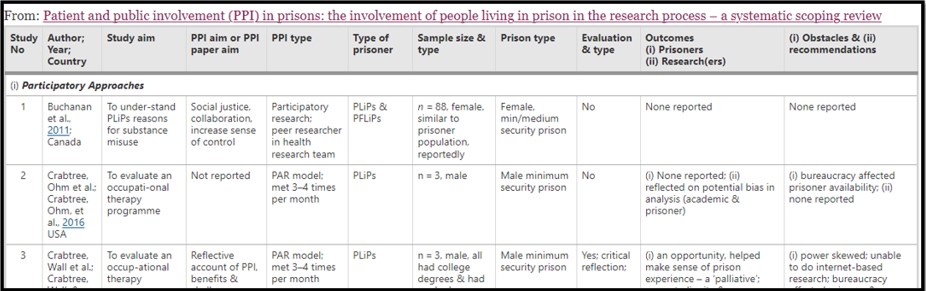
"Data extraction is key to demonstrating that you have followed a systematic approach and handled different studies in a consistent manner. Data extraction is core to the review process and requires intensive effort" (Booth et al., 2022, p. 197).
Sometimes called data extraction, charting the evidence is finding and documenting the data required from each included study. Charting helps to compare what has been reported, what is omitted, and to recognise patterns. It is often recorded on a spreadsheet or template. The data required will depend on the type of review and the research aims or questions. Examples of the type of data often extracted are:
Other fields may also be required depending on the review type. A meta-analysis will require the extraction and charting of the results data and any statistical information given, while a qualitative review will involve concepts or themes. Viewing data in a consistent format allows for easier interpretation and recognition of patterns. It is often recorded using a spreadsheet which can be converted into charts and tables to represent the data visually.